|
Getting your Trinity Audio player ready...
|
If you are learning DAX (Data Analysis Expressions) for Power BI or Power Pivot, you will quickly notice that some functions end with an X – for example, SUMX, AVERAGEX, COUNTX, RANKX.
These functions are called iterator functions in DAX.
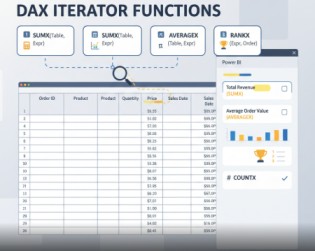
Unlike normal aggregation functions such as SUM or AVERAGE that work directly on a single column, iterator functions work row by row across a table, evaluate an expression for each row, and then aggregate the result.
This row-by-row behavior makes iterators incredibly powerful. They allow you to calculate custom totals, averages, ranks, and conditional counts that are simply not possible with normal functions.
In this post, we’ll cover:
- What iterator functions are and why they are different
- Common iterator functions in DAX (SUMX, AVERAGEX, COUNTX, MAXX, MINX, RANKX)
- 2 practical real-world examples for each function using business-like datasets
- Iterator functions vs normal aggregation functions
- Common mistakes to avoid
- Best practices for MIS and Data Analysts
By the end, you’ll not only understand what iterators do but also know how to apply them in sales reports, HR dashboards, finance analysis, and MIS reporting.
Sample Dataset – to practice Iterator Functions in DAX
We’ll use a Sales dataset throughout this tutorial:
| Product | Quantity | Price | Discount | Salesperson | Region |
|---|---|---|---|---|---|
| A | 10 | 50 | 5 | Rajesh | North |
| B | 5 | 100 | 10 | Sneha | South |
| C | 8 | 75 | 0 | Amit | West |
| D | 12 | 60 | 15 | Priya | East |
| E | 20 | 40 | 5 | Karan | North |
| F | 7 | 120 | 20 | Meera | South |
| G | 15 | 80 | 10 | Ramesh | West |
| H | 9 | 55 | 0 | Sunita | East |
| I | 6 | 200 | 30 | Sneha | South |
| J | 18 | 65 | 5 | Rajesh | North |
1. SUMX – Total with Custom Expressions
The SUMX function lets you calculate totals by applying a formula row by row and then summing the results.
Syntax:
SUMX(Table, Expression)
Example 1: Total Sales (Quantity × Price)
Total Sales = SUMX(Sales, Sales[Quantity] * Sales[Price])
👉 This multiplies Quantity × Price for each row, then adds everything.
👉 Useful for sales totals when unit price is stored separately from quantity.
Example 2: Total Net Sales (After Discount)
Net Sales = SUMX(Sales, (Sales[Quantity] * Sales[Price]) - Sales[Discount])
👉 Here, row-wise discount is subtracted before summing up.
👉 A real MIS example for revenue reports.
Read More: Basic DAX Functions
2. AVERAGEX – Average of Row Calculations
The AVERAGEX function calculates the average of an expression across rows.
Syntax:
AVERAGEX(Table, Expression)
Example 1: Average Sales per Product
Avg Product Sale = AVERAGEX(Sales, Sales[Quantity] * Sales[Price])
👉 Gives the average revenue generated per product.
Example 2: Average Discounted Sales
Avg Net Sale = AVERAGEX(Sales, (Sales[Quantity] * Sales[Price]) - Sales[Discount])
👉 Calculates the average after discount.
👉 Important in finance/retail reporting.
3. COUNTX – Conditional Counting
Unlike COUNT, which only counts numbers in a column, COUNTX lets you count rows based on an expression or condition.
Syntax:
COUNTX(Table, Expression)
Example 1: Count Products with Sales Above 1000
High Sales Count = COUNTX(Sales, IF(Sales[Quantity] * Sales[Price] > 1000, 1, BLANK()))
👉 Counts only rows where sales are above ₹1000.
Example 2: Count Products with Discount Given
Discounted Products = COUNTX(Sales, IF(Sales[Discount] > 0, 1, BLANK()))
👉 Counts how many products had a discount applied.
4. MAXX – Maximum Based on Expression
The MAXX function finds the highest value of a row-by-row expression.
Syntax:
MAXX(Table, Expression)
Example 1: Highest Product Sale
Max Product Sale = MAXX(Sales, Sales[Quantity] * Sales[Price])
👉 Returns the maximum revenue from a single product row.
Example 2: Highest Discount Applied
Max Discount = MAXX(Sales, Sales[Discount])
👉 Returns the maximum discount given on any product.
5. MINX – Minimum Based on Expression
The MINX function finds the lowest value of a row-by-row expression.
Syntax:
MINX(Table, Expression)
Example 1: Lowest Product Sale
Min Product Sale = MINX(Sales, Sales[Quantity] * Sales[Price])
👉 Returns the lowest total sale from a product row.
Example 2: Lowest Discount Applied
Min Discount = MINX(Sales, Sales[Discount])
👉 Returns the smallest discount applied.
6. RANKX – Ranking Rows
The RANKX function assigns ranks to rows based on an expression.
Syntax:
RANKX(Table, Expression, [Value], [Order], [Ties])
Example 1: Rank Products by Sales
Product Sales Rank = RANKX(ALL(Sales[Product]), SUMX(Sales, Sales[Quantity] * Sales[Price]))
👉 Ranks each product by total sales value.
Example 2: Rank Salespeople by Total Sales
Salesperson Rank = RANKX(ALL(Sales[Salesperson]), SUMX(Sales, Sales[Quantity] * Sales[Price]))
👉 Useful in performance reports for incentives or appraisals.
Iterator Functions vs Normal Aggregations
| Function | Normal Example | Iterator Example |
|---|---|---|
| SUM | SUM(Sales[Quantity]) | SUMX(Sales, Sales[Quantity] * Sales[Price]) |
| AVERAGE | AVERAGE(Sales[Price]) | AVERAGEX(Sales, (Sales[Quantity]*Sales[Price])-Sales[Discount]) |
| COUNT | COUNT(Sales[Quantity]) | COUNTX(Sales, IF(Sales[Quantity] > 5, 1, BLANK())) |
👉 Normal functions only work on one column. Iterators let you create custom row-by-row calculations.
Common Mistakes Beginners Make
- Using SUM instead of SUMX when multiplying two columns.
- Forgetting that iterators can be performance-heavy on large datasets.
- Not wrapping conditions in IF inside iterators (leading to wrong counts).
- Confusing calculated columns vs measures when writing iterator functions.
Best Practices
- Use iterator functions only when necessary (simple SUM is faster than SUMX).
- Write iterators as measures instead of calculated columns for better performance.
- Always validate results with sample data to avoid logic errors.
- Use ALL() or FILTER() with iterators for advanced scenarios.
Conclusion
Iterator functions in DAX (SUMX, AVERAGEX, COUNTX, MAXX, MINX, RANKX) are the key to performing complex row-by-row calculations in Power BI and Power Pivot.
They allow Data Analysts and MIS professionals to move beyond simple aggregations and create powerful insights like net sales, average performance, ranking employees, or conditional counts.
Once you master these, you’ll be ready to dive into CALCULATE, FILTER, and Time Intelligence functions, which make DAX even more powerful.
What’s Next?
In the next post, we’ll learn about the Filter Functions in DAX