|
Getting your Trinity Audio player ready...
|
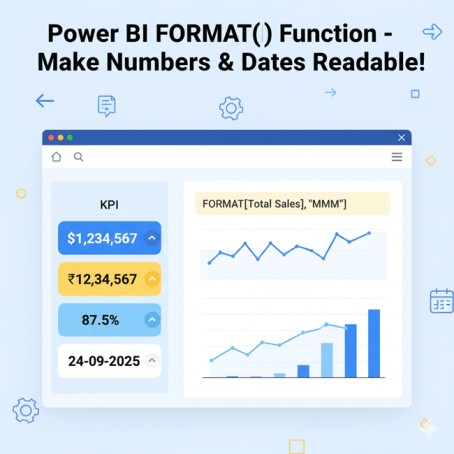
When building Power BI dashboards, you often need numbers, dates, or percentages to look professional and readable. The FORMAT function in DAX allows you to convert numeric or date values into text with your desired formatting, while keeping the original value intact for calculations.

Syntax
FORMAT(<value>, <format_string>[, <locale_name>])
- value → A numeric, date, or time value (can be an expression or measure).
- format_string → Standard or custom .NET format string (e.g., “C”, “0.00”, “dd-mmm-yyyy”).
- locale_name (optional) → Supported in Power BI. Examples: “en-US”, “hi-IN”.
⚠️ Returns text, not numeric values. Use for display purposes (cards, tables, tooltips).
1. Formatting Numbers
Example 1: Currency
FormattedCurrency = FORMAT(1234567, "C")
- Output (en-US locale):
$1,234,567.00 - Output (hi-IN locale):
₹12,34,567.00
Example 2: Currency with 2 Decimals
FormattedCurrency2 = FORMAT(1234.567, "C2")
- Output:
$1,234.57
Example 3: Number with 2 Decimals
FormattedNumber = FORMAT(1234.567, "0.00")
- Output:
1234.57
Example 4: Percentage
FormattedPercent = FORMAT(0.875, "0.0%")
- Output:
87.5%
Example 5: Compact Format (Millions)
FormattedM = FORMAT(1523000/1000000, "0.0") & "M"
- Output:
1.5M
Also Read: Time Intelligence Functions in DAX
2. Formatting Dates
Example 6: Day-Month-Year
FormattedDate1 = FORMAT(TODAY(), "dd-mm-yyyy")
- Output:
24-09-2025
Example 7: Long Date
FormattedDate2 = FORMAT(TODAY(), "dddd, mmmm dd, yyyy")
- Output:
Wednesday, September 24, 2025
Example 8: Month & Year
FormattedDate3 = FORMAT(TODAY(), "mmm yyyy")
- Output:
Sep 2025
Example 9: Quarter & Year
FormattedDate4 = FORMAT(TODAY(), "\Qq yyyy")
- Output:
Q3 2025
Example 10: Weekday Name
FormattedDate5 = FORMAT(TODAY(), "dddd")
- Output:
Wednesday
Read More: CALENDAR Function in DAX
3. Formatting Time
Example 11: 24-hour time
FormattedTime1 = FORMAT(NOW(), "HH:mm")
- Output:
14:35
Example 12: 12-hour time with AM/PM
FormattedTime2 = FORMAT(NOW(), "hh:mm AM/PM")
- Output:
02:35 PM
Example 13: Time with seconds
FormattedTime3 = FORMAT(NOW(), "hh:mm:ss")
- Output:
02:35:45
4. Combining Text & Values
Example 14: Dynamic Sales Title
SalesTitle = "Total Sales for " & FORMAT(TODAY(), "mmmm yyyy")
- Output:
Total Sales for September 2025
Example 15: Currency & Month
TotalSalesFormatted = "Total Sales: " & FORMAT([Total Sales], "C", "en-US")
- Output:
Total Sales: $1,234,567.00
Example 16: Year & Profit
YearProfit = "Year " & FORMAT(YEAR(TODAY()), "0000") & ": " & FORMAT([Profit], "C", "en-US")
- Output:
Year 2025: $875,000.00
5. Locale-Based Formatting
Power BI allows explicit locale formatting, very useful for multi-country dashboards.
-- US format
FORMAT(1234567, "C", "en-US")   -- $1,234,567.00

-- Indian format
FORMAT(1234567, "C", "hi-IN")   -- ₹12,34,567.00
6. Real-Life Use Cases for Data Analysts
- Finance Dashboards
Show revenue, costs, and profit in readable currency format. - Sales Performance
Display KPIs like Conversion Rate in%format and Revenue in Millions/Lakhs. - Attendance Reports
Show weekday names from employee check-in dates. - Management Cards
Present metrics with dynamic text:"Total Sales for September 2025 = $1,234,567"
7. Limitations of Format Function in Power BI
- Always returns text → can’t do numeric operations on formatted measure.
- Large datasets + multiple
FORMAT()calls can affect performance. - Some Excel-style shortcuts (like
"0.0,,M") do not work — you need manual division.
8. Best Practices
- Use
FORMAT()for display only, not calculations. - Aggregate column values before formatting inside measures.
- Use locale parameter in Power BI for multi-country reporting.
- For compact formatting (K/M/Lakh), divide manually and append suffix.
- Keep numeric measures separate from formatted text measures for charts.
9. Quick Reference Table
| Purpose | DAX Example | Output |
|---|---|---|
| Currency | FORMAT(1234567,"C") | $1,234,567.00 |
| Percent | FORMAT(0.875,"0.0%") | 87.5% |
| Fixed decimals | FORMAT(1234.567,"0.00") | 1234.57 |
| Day-Month-Year | FORMAT(TODAY(),"dd-mm-yyyy") | 24-09-2025 |
| Month-Year | FORMAT(TODAY(),"mmm yyyy") | Sep 2025 |
| Weekday | FORMAT(TODAY(),"dddd") | Wednesday |
| 12-hour time | FORMAT(NOW(),"hh:mm AM/PM") | 02:35 PM |
| Compact M | FORMAT([Sales]/1000000,"0.0")&"M" | 1.5M |
| Locale US | FORMAT(1234567,"C","en-US") | $1,234,567.00 |
| Locale India | FORMAT(1234567,"C","hi-IN") | ₹12,34,567.00 |
10. Advanced Tips for Using FORMAT() in Power BI
While FORMAT() is simple to use, there are some advanced tricks that make it extremely useful for Data Analysts and MIS professionals.
a) Combine Multiple Measures in Text
You can dynamically create sentences or KPI statements using multiple measures:
SalesKPI = "Total Sales: " & FORMAT([Total Sales], "C", "en-US") &
           " | Profit Margin: " & FORMAT([Profit Margin], "0.0%") &
           " | Avg Sale per Customer: " & FORMAT([Avg Sale], "0.00")
Output:Total Sales: $1,234,567 | Profit Margin: 12.5% | Avg Sale per Customer: 105.25
This approach allows you to create card visuals or tooltips that combine multiple metrics in a human-readable format.
b) Conditional Formatting with FORMAT()
You can use FORMAT() together with conditional DAX logic to display different formats based on thresholds:
RevenueStatus = IF([Revenue] > 1000000,
                   FORMAT([Revenue], "C", "en-US") & " ✅",
                   FORMAT([Revenue], "C", "en-US") & " ⚠️")
- This shows a checkmark for high revenue and a warning sign for low revenue, which is very useful in dashboards.
c) Handling Dates Dynamically
Suppose you want to show the latest sale date in a readable format:
LatestSaleDate = "Last Sale: " & FORMAT(MAX(Sales[SaleDate]), "dddd, mmm dd, yyyy")
- Output:
Last Sale: Wednesday, Sep 24, 2025 - This can be used in title cards, slicers, or reports, giving management an instant overview.
d) Combine FORMAT() with Iterators
You can combine FORMAT() with iterator functions like SUMX() for more advanced calculations:
HighValueSales =
SUMX(
    FILTER(Sales, Sales[Amount] > 100000),
    FORMAT(Sales[Amount], "C", "en-US")
)
- This converts only the high-value sales into formatted text, which can then be displayed in table visuals.
e) Dynamic Locale Switching
If you have a dashboard for multiple countries, you can dynamically change the locale using a disconnected table for region selection:
SelectedCurrency = FORMAT([Total Sales], "C", SELECTEDVALUE(Regions[Locale]))
- This automatically switches currency symbols and number grouping based on user selection, enhancing interactive dashboards.
Conclusion
The FORMAT function in Power BI DAX is essential for presentation-ready dashboards. It helps convert raw numbers, percentages, dates, and times into readable, professional formats for reports and management cards.