|
Getting your Trinity Audio player ready...
|
If you’re learning Python for data analysis, one of the first questions you’ll face is:
“What is the difference between a Pandas Series and a DataFrame in Pandas?”
This comparison forms the foundation of Pandas. Whether you are analyzing sales data, processing MIS reports, or preparing datasets for machine learning, understanding Series and DataFrame will make your work faster and much easier.
In this guide, we’ll break things down in the simplest way possible—no complicated jargon—just clear explanations, real-world examples, and step-by-step comparisons.
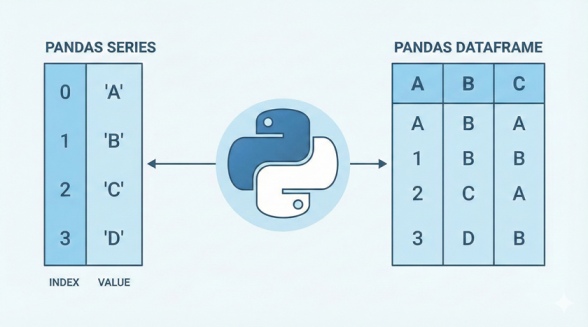
1. What is a Pandas Series?
A Series is like a single column of data.
Think of it as a list with labels.
Simple example:
import pandas as pd

sales = pd.Series([120, 150, 100, 170])
print(sales)
Output:
0    120
1    150
2    100
3    170
dtype: int64
Key Points About Series
- One-dimensional
- Has index (labels)
- Holds any data type (int, float, string)
- Can be part of a DataFrame column
Real-Life Analogy
A Series is like a single column in Excel (e.g., “Sales Amount”).
2. What is a Pandas DataFrame?
A DataFrame is a table—multiple columns, multiple rows.
Syntax:
pd.DataFrame(data=None, index=None, columns=None, dtype=None, copy=None)
Example:
data = {
    "Product": ["Laptop", "Mouse", "Keyboard"],
    "Price": [50000, 700, 1500],
    "Stock": [50, 200, 120]
}

df = pd.DataFrame(data)
print(df)
Output:
| Product | Price | Stock | |
|---|---|---|---|
| 0 | Laptop | 50000 | 50 |
| 1 | Mouse | 700 | 200 |
| 2 | Keyboard | 1500 | 120 |
Key Points About DataFrame
- Two-dimensional
- Collection of multiple Series
- Columns can have different data types
- Most commonly used Pandas object
Real-Life Analogy
A DataFrame is like an Excel sheet with multiple columns.
Also Read: Introduction to Pandas
3. Series vs DataFrame: Key Differences
| Feature | Series | DataFrame |
|---|---|---|
| Dimension | 1D | 2D |
| Structure | Single column | Rows + columns |
| Data Type | Single type | Multiple types across columns |
| Use case | Single-variable analysis | Multi-variable analysis |
| Example | Sales numbers | Full sales report |
4. Real-Life Examples of Series
Example 1: Daily website traffic
visitors = pd.Series([1200, 1500, 1700, 1600])
Example 2: Product names
products = pd.Series(["Shoes", "Bag", "Watch"])
Example 3: Employee attendance
attendance = pd.Series(["P", "A", "P", "P"])
How a Series helps
- Quick calculations
- Single-column filtering
- Great for charts
5. Real-Life Examples of DataFrame
Example 1: Student marks sheet
df = pd.DataFrame({
    "Name": ["Amit", "Priya", "Rahul"],
    "Maths": [87, 92, 76],
    "Science": [91, 88, 80]
})
Example 2: MIS daily report
| Date | Tickets Received | Tickets Resolved | Pending |
|---|---|---|---|
| 01-12-2024 | 120 | 100 | 20 |
| 02-12-2024 | 140 | 130 | 10 |
Example 3: Sales dashboard dataset
- Product
- Category
- MRP
- Outlet Type
- Monthly Sales
This requires multiple columns → DataFrame is the right choice.
6. When to Use Series vs DataFrame
Use Series When:
- Working on a single column
- Performing statistical operations (mean, sum, max)
- Extracting one variable for ML
Use DataFrame When:
- Loading CSV/Excel files
- Working with multiple columns
- Preparing data for dashboards
- Joining, merging, or filtering large datasets
7. Converting Between Series and DataFrame
Series → DataFrame
s = pd.Series([10, 20, 30])
df = s.to_frame(name="Numbers")
DataFrame Column → Series
series = df["Price"]
Single Row → Series
row_series = df.loc[0]
8. Use Cases in Business, MIS & Data Analysis
A. MIS Reporting
- Series: Daily ticket count
- DataFrame: Complete SLA dashboard
B. Accounting
- Series: Daily expenses
- DataFrame: Ledger entries
C. Ecommerce
- Series: Product ratings
- DataFrame: Inventory, sales, discounts
D. Machine Learning
- Series → Target variable (y)
- DataFrame → Features (X)
9. Common Mistakes Beginners Make
❌ Treating Series as lists (they have indexes, not positions)
❌ Forgetting DataFrame columns are Series
❌ Creating DataFrames with unequal column lengths
❌ Misunderstanding axis while applying functions
10. Best Practices
✅ Use Series for single-dimensional data
✅ Use DataFrame for multi-column datasets
✅ Always name your Series for clarity
pd.Series([1,2,3], name="Revenue")
✅ Prefer DataFrames when reading CSV/Excel files
pd.read_csv("sales.csv")
✅ Use .head() and .info() to explore data
11. Conclusion
Series and DataFrame are the backbone of Pandas.
A Series is a single labeled column, while a DataFrame is a complete table. Understanding when to use each will make your data analysis smoother, more efficient, and much more enjoyable.
Whether you’re building dashboards, doing MIS reporting, or preparing datasets for machine learning—mastering these two structures is the first big step toward becoming confident with Pandas.
What’s Next?
In the next post, we’ll learn about the Basic Functions in Pandas