|
Getting your Trinity Audio player ready...
|
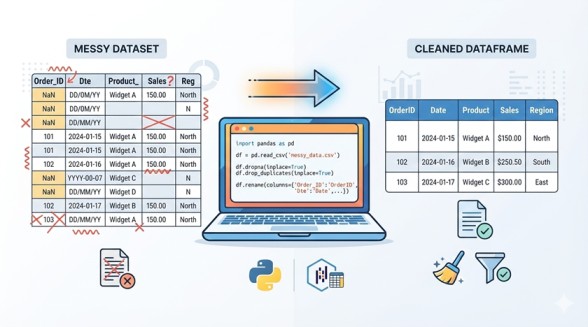
In real life, data is never clean.
If you are working in MIS, sales reporting, HR data, finance, or analytics, you will rarely get a perfect dataset. Instead, you will face problems like:
- Missing values
- Wrong column names
- Extra spaces in text
- Different spellings for the same value
- Incorrect data types
- Duplicate records
- Mixed formats like “Yes/No”, “Y/N”, “1/0”
This is where data cleaning becomes the most important skill.
In fact, most data analysts spend 60–70% of their time cleaning data, not analyzing it.
In this article, you will learn cleaning data in Pandas, step by step, using easy language and real-life examples.
What Cleaning Data in Pandas is?
Data cleaning means:
- Fixing missing or incorrect values
- Making data consistent
- Preparing data for analysis or reporting
In Pandas, data cleaning is done using simple functions and methods like:
isnull(),fillna(),dropna()rename()replace()map()combine_first()astype()strfunctions
Sample Dataset Used
We will continue using the sales dataset you already saw earlier.
This makes learning easier because the examples feel real.
Some common issues in our dataset:
- Missing
SalesRep - Missing
Rating - Inconsistent text
- Need to calculate new columns
- Columns not properly named
Also Read: Basic Functions in Pandas
Step 1: Load the Dataset
import pandas as pd

url = "https://docs.google.com/spreadsheets/d/e/2PACX-1vTR5NhWbt9Vwz4I4C9r2R7UqmDQrkX_zbeCEykWkWQN3c217r3UFtdSEOwufhT71oC-sy_OzAA9QVIn/pub?gid=0&single=true&output=tsv"

df = pd.read_csv(url, sep="\t")
Step 2: Understand the Data Before Cleaning
Before cleaning, always understand what is wrong.
2.1 Check Basic Info
df.info()
This shows:
- Column names
- Data types
- Missing values
2.2 Check Missing Values
df.isnull().sum()
Example output:
- SalesRep → missing
- Rating → missing
Step 3: Renaming Columns
Messy column names are very common in real datasets.
3.1 Why Rename Columns?
Bad column names:
- Have spaces
- Are not meaningful
- Hard to use in code
3.2 Rename Columns Properly
df = df.rename(columns={
    "UnitPrice": "Unit_Price",
    "PaymentMethod": "Payment_Method"
})
Best Practice for Column Names
- Use lowercase
- Use underscores
- Avoid spaces
Example:
df.columns = df.columns.str.lower()
Step 4: Handling Missing Values
Missing data is one of the most common problems.
4.1 Detect Missing Values
df.isnull().sum()
4.2 Fill Missing Text Values
For columns like SalesRep, missing value means no data available.
df["salesrep"] = df["salesrep"].fillna("Unknown")
4.3 Fill Missing Numeric Values
For rating, we can use the average rating.
df["rating"] = df["rating"].fillna(df["rating"].mean())
4.4 Drop Rows with Missing Values (When Required)
df.dropna()
⚠ Use carefully. Dropping data means losing information.
Step 5: Replacing Values in a Column (Real-Life Example)
This is extremely common in MIS and reporting.
Example: Status Column
Imagine a column Status with values:
- “Completed”
- “complete”
- “Done”
- “Pending”
- “In Progress”
We want:
- Completed → Completed
- Done → Completed
- complete → Completed
5.1 Replace Values Using replace()
df["status"] = df["status"].replace({
    "Done": "Completed",
    "complete": "Completed"
})
5.2 Replace Multiple Values
df["payment_method"] = df["payment_method"].replace({
    "Credit Card": "Card",
    "Debit Card": "Card"
})
5.3 Fill Empty Values by Mode in a Column (Most Common Value)
In real-life MIS and reporting data, many columns contain repeating values such as Region, Category, Payment Method, Status, Department, etc. When some values are missing in these columns, the best logical choice is often to fill them with the most frequently occurring value, also called the mode.
This approach keeps the data realistic and consistent, especially for categorical columns.
Why use Mode instead of Mean or Median?
- Mean / Median work well for numeric data
- Mode is best for text or category-based data
- Common in:
- Sales reports (Region, Payment Method)
- MIS dashboards (Status, Module Name)
- Helpdesk or HR data (Department, Priority)
Example Code
df.apply(lambda col: col.fillna(col.mode().iloc[0]))
Step-by-Step Explanation
Let’s break this line into simple parts:
df.apply(...)- Applies a function column by column on the DataFrame.
col.mode()- Finds the most common value in the column.
iloc[0]- If there are multiple modes, this picks the first one.
col.fillna(...)- Replaces all missing (
NaN) values in that column with the mode.
- Replaces all missing (
✅ Result:
Each column gets its missing values filled with its own most frequent value.
Real-Life Sales Report Example
Suppose your Region column looks like this:
| OrderID | Region |
|---|---|
| 1001 | North |
| 1002 | North |
| 1003 | NaN |
| 1004 | South |
| 1005 | North |
- Mode of Region =
North - Missing value automatically becomes
North
When Should You Use This Method?
✔ Best for:
- Categorical columns (text-based)
- Status, Category, Region, Payment Method
- Large datasets where manual filling is not possible
❌ Avoid for:
- Unique ID columns
- Continuous numeric columns (Sales, Quantity, Price)
Best Practice Tip
If your dataset contains both numeric and text columns, apply this method only to categorical columns:
cat_cols = df.select_dtypes(include='object')
df[cat_cols.columns] = cat_cols.apply(lambda col: col.fillna(col.mode().iloc[0]))
Why MIS & Data Analysts Use This Often
- Keeps reports consistent
- Avoids dropping important rows
- Saves time compared to manual cleaning
- Produces realistic data for dashboards and KPIs
Step 6: Cleaning Text Data
Text data often has:
- Extra spaces
- Mixed cases
- Wrong formatting
6.1 Remove Extra Spaces
df["product"] = df["product"].str.strip()
6.2 Convert Text to Upper / Lower Case
df["category"] = df["category"].str.upper()
6.3 Replace Text Using str.replace()
df["product"] = df["product"].str.replace(" ", "_")
Step 7: Changing Data Types
Wrong data types cause errors later.
7.1 Convert Date Column
df["date"] = pd.to_datetime(df["date"])
7.2 Convert Quantity to Integer
df["quantity"] = df["quantity"].astype(int)
7.3 Convert Rating to Float
df["rating"] = df["rating"].astype(float)
Step 8: Removing Duplicate Records
Duplicates create wrong totals.
8.1 Check Duplicate Rows
df.duplicated().sum()
8.2 Remove Duplicates
df = df.drop_duplicates()
Step 9: Creating New Clean Columns
9.1 Create Total Sales Column
df["total_sales"] = df["quantity"] * df["unit_price"]
9.2 Create Year and Month Columns
df["year"] = df["date"].dt.year
df["month"] = df["date"].dt.month
Step 10: Using map() Function (Very Important)
map() is used to convert values using a dictionary.
10.1 Example: Rating Category
rating_map = {
    5: "Excellent",
    4: "Good",
    3: "Average"
}

df["rating_category"] = df["rating"].round().map(rating_map)
10.2 Example: Region Codes
region_map = {
    "North": "N",
    "South": "S",
    "East": "E",
    "West": "W"
}

df["region_code"] = df["region"].map(region_map)
10.3 Example: Using map() with set_index()
In real-life sales data, it is very common to receive incomplete reports.
Sometimes the SalesRep name is missing, but we have another reference file that contains the correct mapping.
Real-Life Sales Scenario
You have two datasets:
Main Sales Report (sales_df)
Some orders are missing the SalesRep name.
| OrderID | Region | SalesRep | TotalSales |
|---|---|---|---|
| 1001 | North | John Smith | 1200 |
| 1005 | North | (blank) | 150 |
| 1009 | North | (blank) | 800 |
| 1017 | North | John Smith | 250 |
Reference Sales Mapping (rep_df)
This file contains correct Region → SalesRep mapping.
| Region | SalesRep |
|---|---|
| North | John Smith |
| South | Sarah Lee |
| East | Mike Brown |
| West | Anna Wang |
Goal
✔ Fill missing SalesRep in the main sales report
✔ Use Region as the lookup key
✔ Keep existing SalesRep values unchanged
Solution Using map() + set_index() + fillna()
sales_df['SalesRep'] = sales_df['SalesRep'].fillna(
    sales_df['Region'].map(
        rep_df.set_index('Region')['SalesRep']
    )
)
How This Works (Simple Explanation)
rep_df.set_index('Region')
Makes Region the lookup key['SalesRep']
Selects the value to fetchmap()
Matches Region fromsales_dfand fetches SalesRepfillna()
Fills only missing SalesRep values
Output After Cleaning
| OrderID | Region | SalesRep | TotalSales |
|---|---|---|---|
| 1001 | North | John Smith | 1200 |
| 1005 | North | John Smith | 150 |
| 1009 | North | John Smith | 800 |
| 1017 | North | John Smith | 250 |
Why This Pattern Is Important in Sales Data
✔ Common in sales & MIS reports
✔ Avoids heavy merge() operations
✔ Faster than joins for simple lookups
✔ Perfect for Region → Rep, Product → Category, Customer → Segment mapping
When to Use map() with set_index()
- Filling missing SalesRep names
- Mapping Product → Category
- Mapping Region → Manager
- Mapping CustomerID → Customer Type
Step 11: Using combine_first() (Advanced but Useful)
combine_first() is used to fill missing values from another column.
Real-Life Example
Suppose you have:
SalesRep_ManualSalesRep_System
If SalesRep_Manual is missing, use SalesRep_System.
df["final_salesrep"] = df["salesrep_manual"].combine_first(df["salesrep_system"])
This is very useful in:
- HR data
- CRM systems
- MIS reports
11.1 Example: Using combine_first() with map() in a Sales Report
In real-world sales data, you often receive two reports for the same period:
- One master or updated report (more reliable)
- One existing or older report (may have partial information)
Your goal is:
✅ Prefer values from the updated report
✅ Keep existing values only when updated data is missing
This is exactly where combine_first() is useful.
Sales Scenario
You have two DataFrames:
Main Sales Report (sales_df)
This is the report you are cleaning.
| OrderID | Product | Category |
|---|---|---|
| 1001 | Laptop | Electronics |
| 1002 | Mouse | (blank) |
| 1003 | Desk Chair | Furniture |
| 1004 | Notebook | (blank) |
Updated Product–Category Mapping (product_df)
This file contains complete and corrected category information.
| Product | Category |
|---|---|
| Laptop | Electronics |
| Mouse | Electronics |
| Notebook | Stationery |
| Desk Chair | Furniture |
Requirement
✔ Take Category from product_df wherever available
✔ If not found, keep existing Category from sales_df
✔ Avoid using merge()
Step 1: Map Category from Updated File
mapped = sales_df['Product'].map(
    product_df.set_index('Product')['Category']
)
This creates a temporary Series:
| Product | mapped |
|---|---|
| Laptop | Electronics |
| Mouse | Electronics |
| Desk Chair | Furniture |
| Notebook | Stationery |
Step 2: Use combine_first() to Update Column
sales_df['Category'] = mapped.combine_first(sales_df['Category'])
Final Cleaned Sales Report
| OrderID | Product | Category |
|---|---|---|
| 1001 | Laptop | Electronics |
| 1002 | Mouse | Electronics |
| 1003 | Desk Chair | Furniture |
| 1004 | Notebook | Stationery |
Why combine_first() Is Perfect Here
- Takes values from mapped (df1) first
- Keeps existing values from sales_df only if mapped is missing
- Prevents overwriting good existing data
- Cleaner and faster than
merge()for simple lookups
Important Concept (Easy to Remember)
mapped.combine_first(original)
➡ “Take mapped values first, otherwise use original values”
Real-Life Use Cases in Sales & MIS Reports
- Product → Category updates
- Region → Sales Manager mapping
- CustomerID → Customer Segment
- OrderID → Status updates
When NOT to Use This
❌ When you need multiple columns
❌ When relationships are many-to-many
❌ When you need row-level joins
For single-column updates, this is one of the cleanest Pandas patterns you should know.
Step 12: Conditional Cleaning Using where()
df["rating"] = df["rating"].where(df["rating"] <= 5, 5)
This ensures rating never exceeds 5.
Step 13: Validating Cleaned Data
Always validate after cleaning.
df.info()
df.describe()
df.isnull().sum()
Common Real-Life Data Cleaning Scenarios
✔ Sales Data
- Missing sales reps
- Incorrect prices
- Duplicate orders
✔ HR Data
- Missing employee names
- Different department names
- Incorrect joining dates
✔ Finance Data
- Null amounts
- Wrong formats
- Duplicate transactions
Benefits of Cleaning Data in Pandas
- Accurate analysis
- Reliable reports
- Faster automation
- Less manual Excel work
- Better decision-making
Challenges Beginners Face
- Not checking data before cleaning
- Dropping rows unnecessarily
- Using wrong data types
- Ignoring text inconsistencies
Best Practices for Data Cleaning
✔ Always explore data first
✔ Rename columns early
✔ Handle missing values carefully
✔ Use map() for value conversion
✔ Use combine_first() for fallback logic
✔ Keep raw and cleaned data separate
✔ Document your cleaning steps
Conclusion
Data cleaning is the foundation of data analysis. Without clean data, even the best analysis gives wrong results.
With Pandas, data cleaning becomes simple, readable, and repeatable. Once you master these techniques, you can confidently handle real-world datasets used in MIS, analytics, finance, and reporting roles.
This guide gives you everything you need to clean data like a professional—step by step, using real examples.
FAQs – Cleaning Data in Pandas
Why is data cleaning important before analysis?
Without cleaning, your analysis can give wrong results. Missing values, wrong spellings, duplicates, or incorrect data types can completely change totals, averages, and insights.
Which Pandas functions are most commonly used for data cleaning?
Some of the most used functions are:
isna()/notna()fillna()dropna()replace()rename()astype()map()combine_first()duplicated()/drop_duplicates()
What is the difference between fillna() and combine_first()?
fillna()fills missing values with a fixed value (like0or"Unknown").combine_first()fills missing values using another column or Series, which is useful for lookup-based cleaning.
When should I use map() for cleaning data?
Use map() when you want to:
Replace values based on a reference table
Standardize names (e.g., regions, products, categories)
Fetch values from another DataFrame using a key column
Why is map() often used with set_index()?
set_index() makes a column act like a lookup key. When combined with map(), it allows fast and clean value matching without using complex joins.
What happens if map() does not find a matching value?
If no match is found, Pandas returns NaN. This is why combine_first() is commonly used to keep existing values instead of overwriting them.
How do I find and remove duplicate rows in Pandas?
df.duplicated()
df.drop_duplicates()
Can data cleaning change original data permanently?
Yes, if you use inplace=True.
Best practice is to first create a copy:
Is Pandas data cleaning enough for real-world projects?
For most MIS, sales analysis, reporting, and dashboards, Pandas is more than enough. For very large or streaming data, additional tools may be required.
What’s Next?
In the next post, we’ll learn about the Resample Function in Pandas