|
Getting your Trinity Audio player ready...
|
When you work with time-based data like sales reports, attendance logs, website traffic, or MIS dashboards, one common question always comes up:
“How do I summarize this data by day, week, month, quarter, or year?”
This is exactly where df.resample() in Pandas becomes extremely powerful.
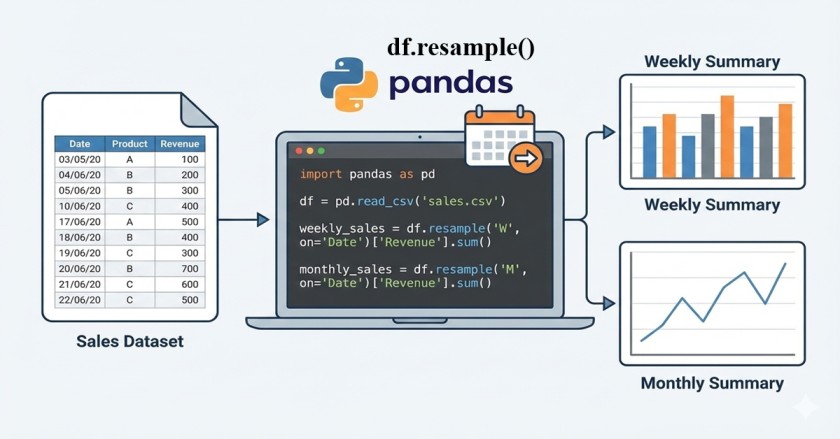
The resample() function allows you to group data by time and then apply calculations like sum, mean, count, max, min, etc. It works very similar to Pivot Tables in Excel or GROUP BY Date in SQL — but in a much more flexible way.
In this article, we’ll understand:
- What
df.resample()is - How it works step by step
- Weekly, monthly, quarterly, and yearly resampling
- The correct usage of MS, QS, QE (since
MandQare being deprecated) - Real-life sales examples
- Common mistakes and best practices
All explanations are in easy, practical language, perfect for MIS, Data Analyst, and Python beginners.
What is df.resample() in Pandas?
df.resample() is used to change the frequency of time-series data.
In simple words:
- It groups data based on time
- Then applies an aggregation function like
sum(),mean(),count(), etc.
👉 It works only when:
- Your DataFrame has a DateTime index, OR
- You explicitly pass a date column using
on='Date'
Basic Syntax of resample()
df.resample(rule).aggregation()
Or when the date is a column:
df.resample(rule, on='Date').aggregation()
Understanding Resample Rules (Very Important)
| Rule | Meaning |
|---|---|
| D | Daily |
| W | Weekly |
| MS | Month Start |
| QS | Quarter Start |
| QE | Quarter End |
| YS | Year Start |
| YE | Year End |
⚠️ Important Note
M(Month End) andQ(Quarter End) are being deprecated- Always use MS, QS, QE for future-proof code
Sample Dataset (Sales Example)
Assume you have a sales dataset like this:
| Date | Product | Quantity | Sales |
|---|---|---|---|
| 2023-01-01 | Laptop | 1 | 1200 |
| 2023-01-03 | Mouse | 2 | 50 |
| 2023-01-08 | Keyboard | 1 | 85 |
| 2023-01-15 | Monitor | 1 | 450 |
| 2023-02-02 | Laptop | 1 | 1200 |
| 2023-02-10 | Mouse | 3 | 75 |
Read More: Basic Functions in Pandas
Convert Date Column to DateTime (Must Do)
df['Date'] = pd.to_datetime(df['Date'])
Without this step, resample() will not work properly.
Example 1: Weekly Sales Quantity (Most Common Use Case)
Requirement
Show total quantity sold per week.
Code
df.resample("W", on='Date')['Quantity'].sum()
Explanation
"W"→ Weekly groupingon='Date'→ Date column used for grouping['Quantity']→ Column to aggregatesum()→ Total quantity per week
Output (Conceptual)
| Week Ending | Quantity |
|---|---|
| 2023-01-08 | 4 |
| 2023-01-15 | 2 |
| 2023-02-12 | 4 |
👉 This is very useful in weekly MIS reports.
Example 2: Monthly Sales using MS (Month Start)
Why use MS instead of M?
M(Month End) is being deprecatedMS= Month Start (recommended)
Code
df.resample("MS", on='Date')['Sales'].sum()
Output
| Month | Total Sales |
|---|---|
| 2023-01-01 | 1785 |
| 2023-02-01 | 1275 |
Example 3: Monthly Average Sales
df.resample("MS", on='Date')['Sales'].mean()
✔ Useful for:
- Average revenue tracking
- Performance analysis
Example 4: Quarterly Sales using QE (Quarter End)
Since Q is deprecated, always use QE.
df.resample("QE", on='Date')['Sales'].sum()
When to use QE?
- Financial reports
- Quarterly business reviews
- Management dashboards
Example 5: Yearly Sales Summary
df.resample("YS", on='Date')['Sales'].sum()
✔ Common in:
- Annual MIS reports
- Year-on-year analysis
Resample with Multiple Aggregations
You can calculate multiple metrics at once:
df.resample("MS", on='Date').agg({
    'Sales': 'sum',
    'Quantity': 'sum'
})
Resample vs Groupby – What’s the Difference?
| Feature | resample() | groupby() |
|---|---|---|
| Time-based grouping | ✅ Best | ⚠️ Manual |
| Handles missing dates | ✅ Yes | ❌ No |
| Time-series friendly | ✅ | ❌ |
| Non-date grouping | ❌ | ✅ |
👉 Use resample when time is involved.
Common Mistakes to Avoid
❌ Date column not in datetime format
❌ Using deprecated rules like M, Q
❌ Forgetting on='Date'
❌ Using resample for non-time data
Best Practices for Using resample()
✅ Always convert date columns using pd.to_datetime()
✅ Use MS, QS, QE instead of deprecated rules
✅ Combine with .agg() for MIS-style summaries
✅ Keep date column clean (no text, no nulls)
Real-Life MIS Use Cases
- Weekly ticket count reports
- Monthly sales performance dashboards
- Quarterly finance summaries
- Yearly growth analysis
- Attendance tracking
Challenges with resample()
- Requires clean date data
- Not suitable for categorical grouping
- Beginners often confuse it with groupby
👉 Once understood, it becomes one of the most powerful Pandas tools.
Conclusion
The df.resample() function is a must-know skill for anyone working with time-based data in Pandas. Whether you are building MIS reports, sales dashboards, or analytical summaries, resampling helps you turn raw daily data into meaningful insights.
By using future-proof rules like MS and QE, you ensure your code remains stable even as Pandas evolves.
If you are serious about Data Analysis, MIS, or Python reporting, mastering resample() will give you a strong edge.
FAQs – Resample Function in Pandas
Is resample faster than groupby?
For time-series data, yes. It is optimized for date-based grouping.
Why is Pandas deprecating M and Q?
To make time rules more explicit. MS, QS, and QE clearly define start and end periods.
Can I resample text columns?
No. Resample is meant for numeric aggregation.
Can I use resample() without on='Date'? Yes, by setting Date as index
Yes. If your Date column is already set as the DataFrame index, you can use resample() directly without mentioning on='Date'.
Step 1: Convert Date to datetime
Step 2: Set Date as index
Step 3: Resample without on='Date'
What’s Next?
In the next post, we’ll learn about the Merge Function in Pandas