|
Getting your Trinity Audio player ready...
|
What is Power BI?
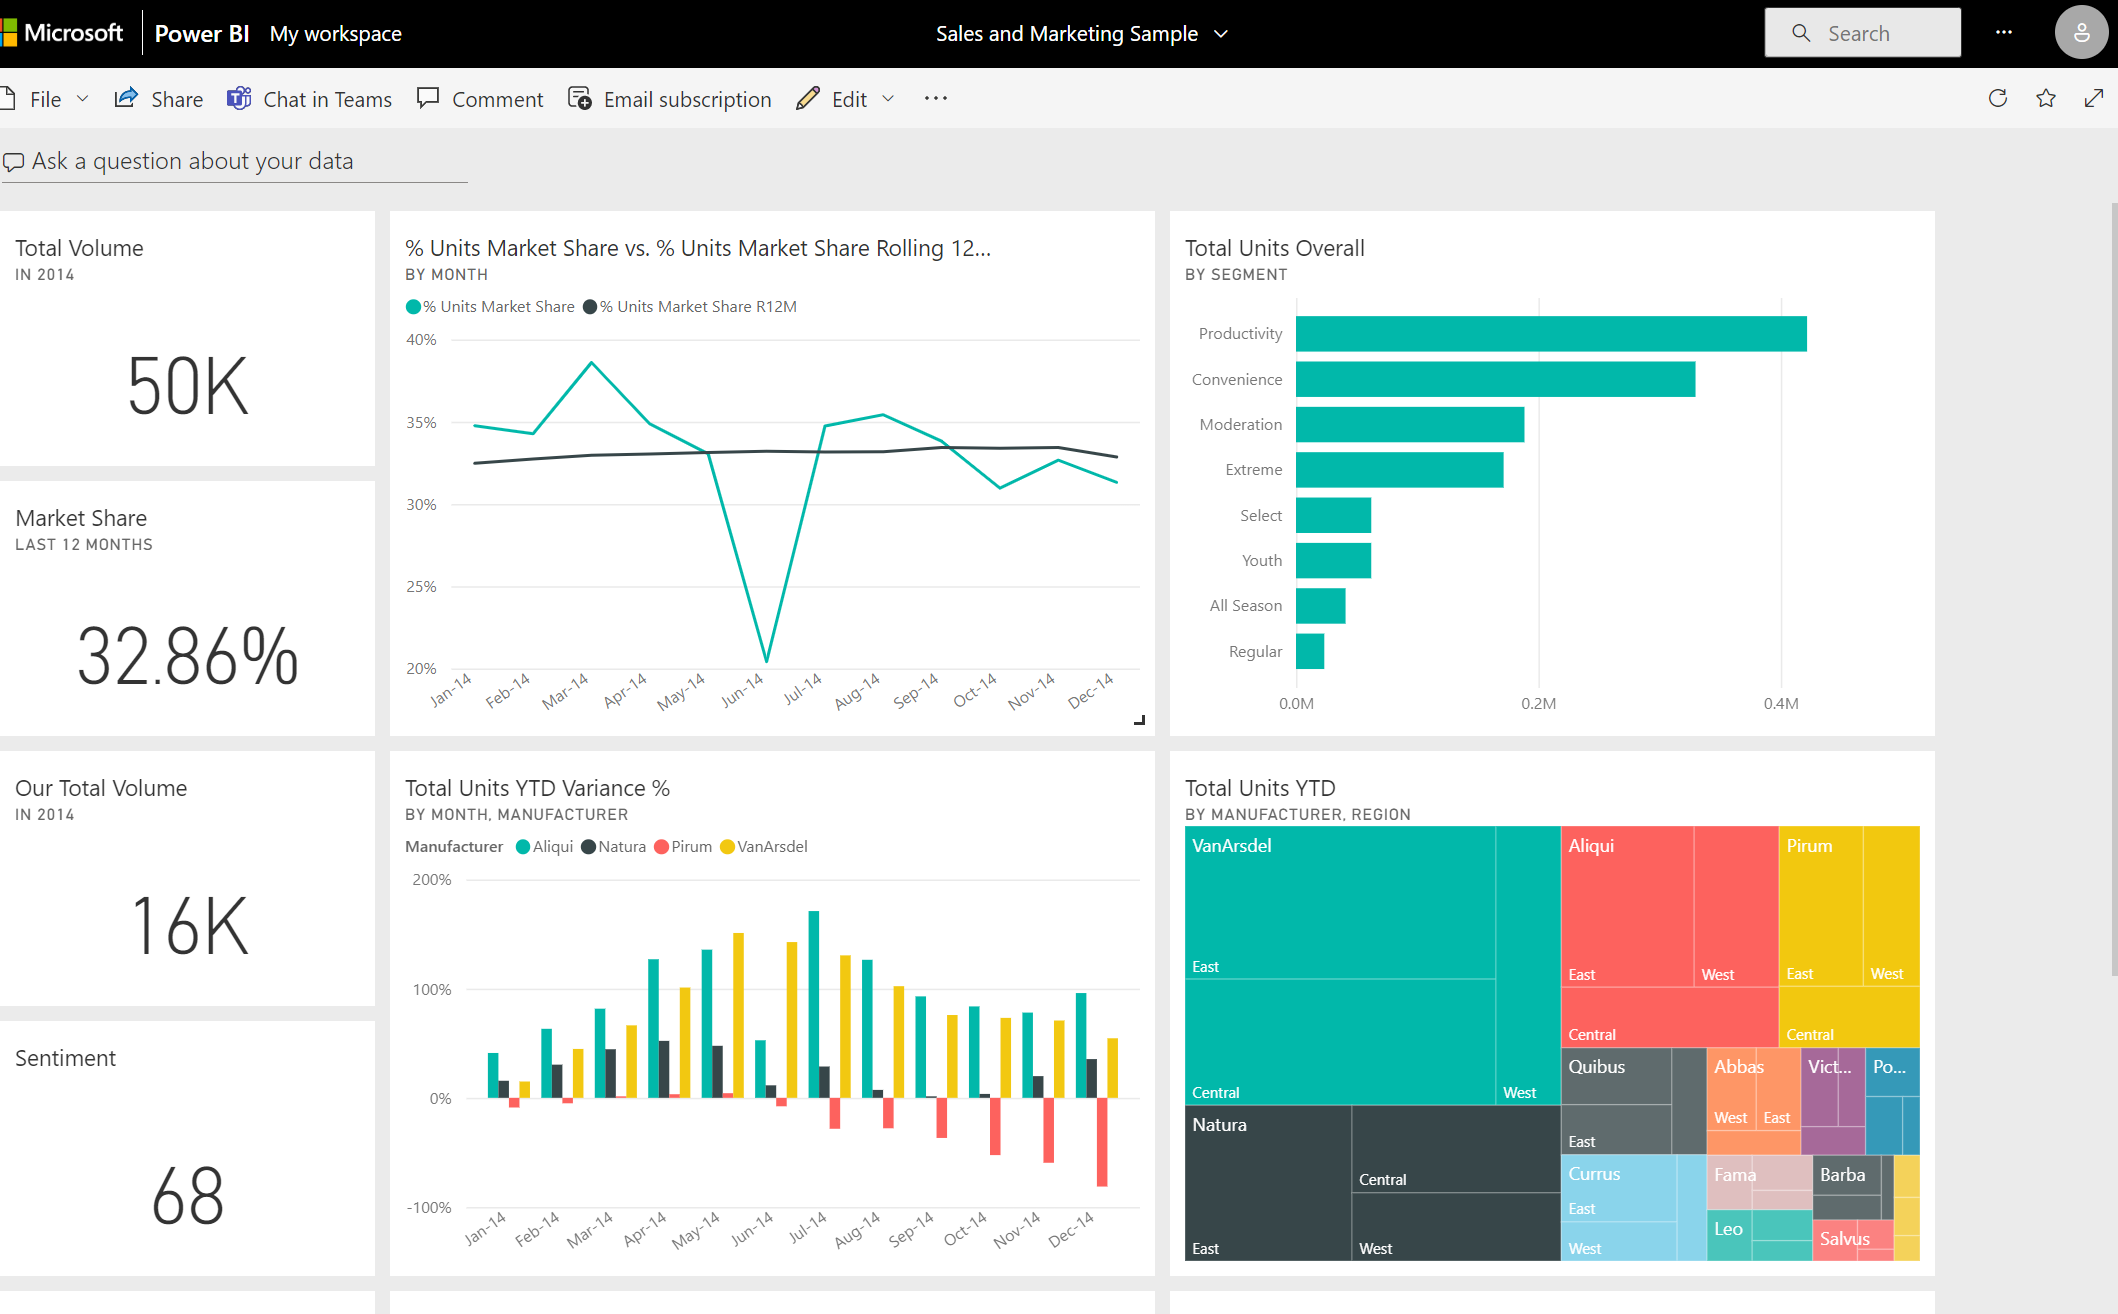
Microsoft Power BI is a Business Intelligence (BI) and Data Visualization tool developed by Microsoft.
In simple words, Power BI helps you convert raw data into meaningful reports and interactive dashboards.
For example:
If you have sales data in Excel with 5,000 rows, Power BI can help you:
- Create charts in seconds
- Track monthly sales growth
- Compare region-wise performance
- Identify top-selling products
- Create professional dashboards
Why is Power BI Important?
Today, every company works with data.
Data is available everywhere:
- Sales data
- Employee data
- Financial data
- Customer data
But raw data in Excel sheets is difficult to understand.
Power BI helps you:
✔ Analyze data easily
✔ Make better business decisions
✔ Save time on manual reports
✔ Present data professionally
That’s why Power BI is one of the most demanded skills for Data Analysts and MIS Executives.
What is Business Intelligence (BI)?
Business Intelligence means:
Using data to make smart business decisions.
Power BI is a BI tool that helps companies:
- Track performance
- Monitor KPIs
- Identify trends
- Predict future growth
Main Components of Power BI
Power BI has different parts:
1️⃣ Power BI Desktop

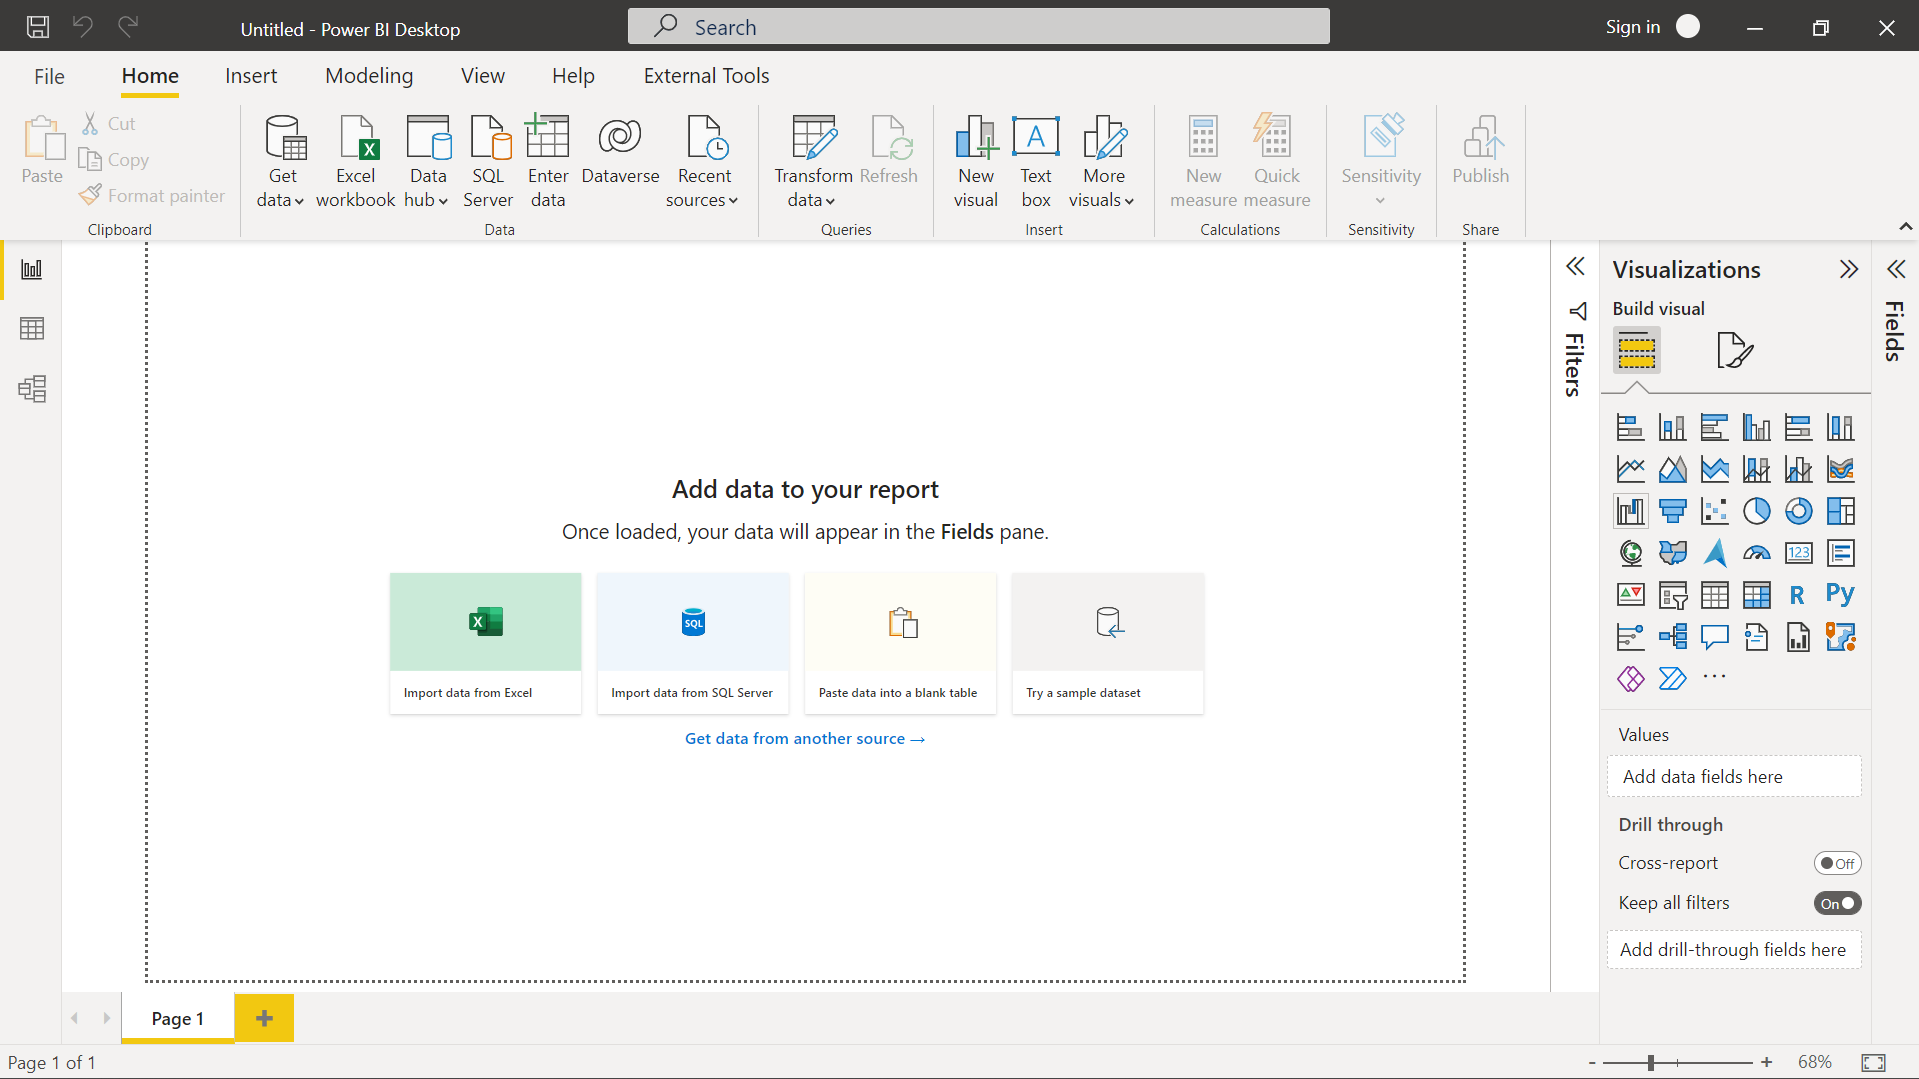
This is a free software installed on your computer.
You use it to:
- Import data
- Clean data
- Create relationships
- Build dashboards
Most of your learning will start with Power BI Desktop.
2️⃣ Power BI Service
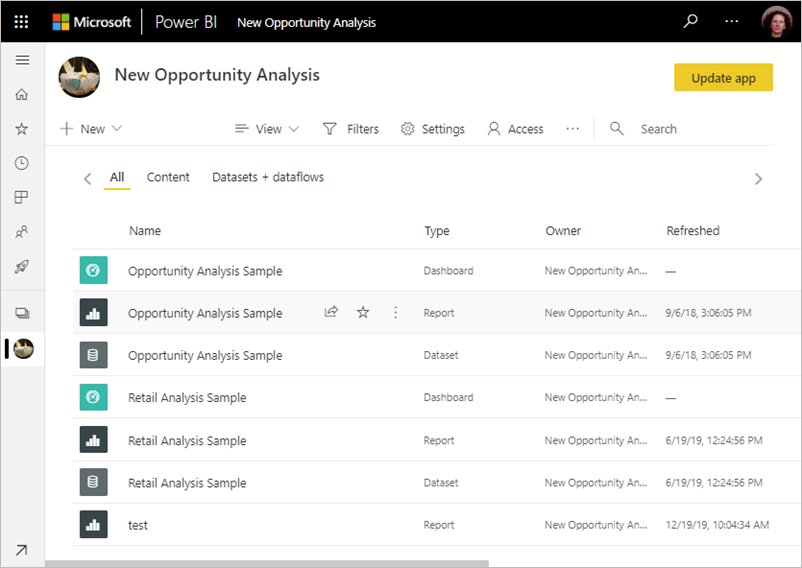
This is the online version (cloud-based).
You use it to:
- Publish reports
- Share dashboards
- Schedule data refresh
- Collaborate with your team
3️⃣ Power BI Mobile
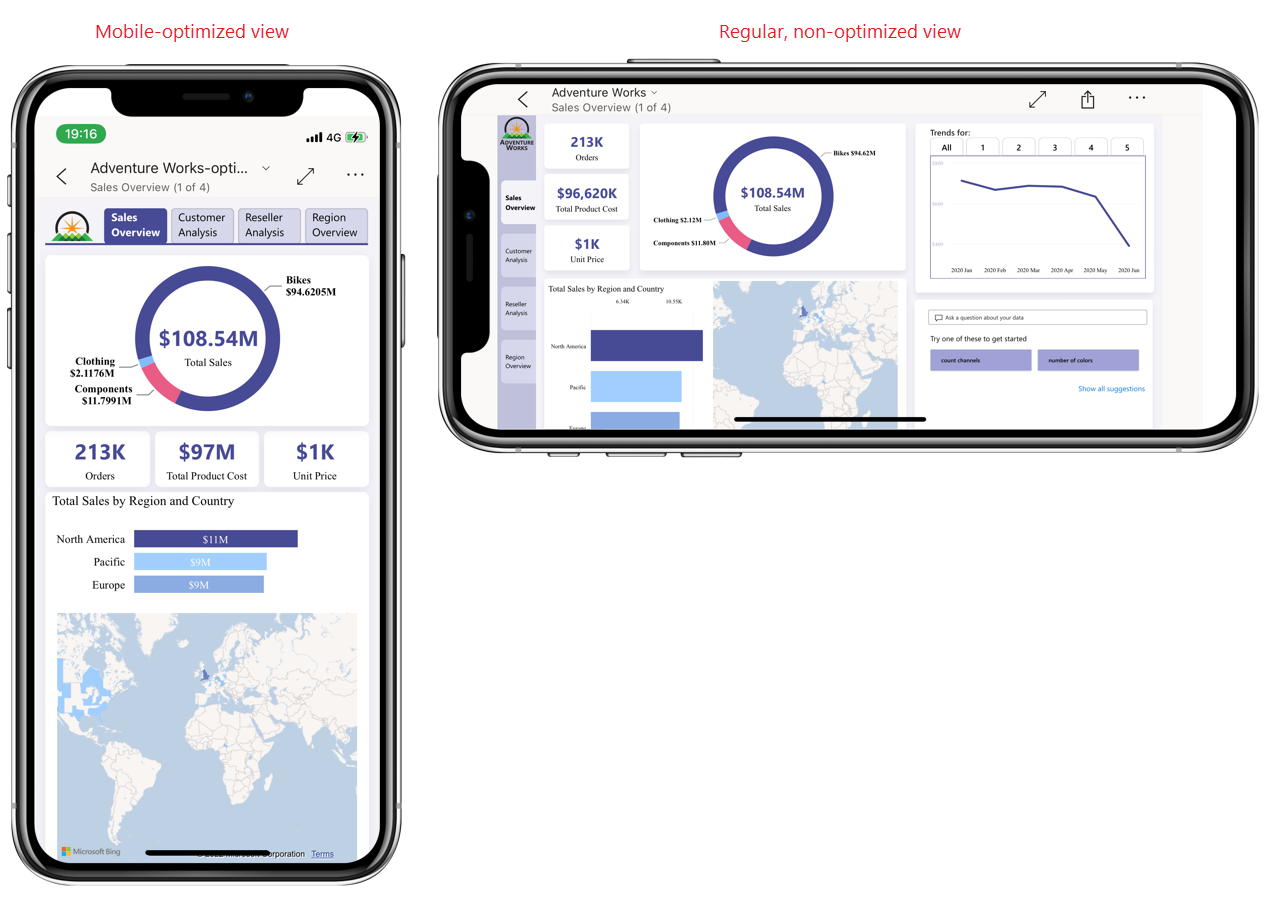
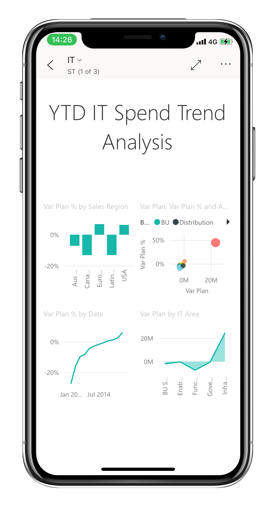
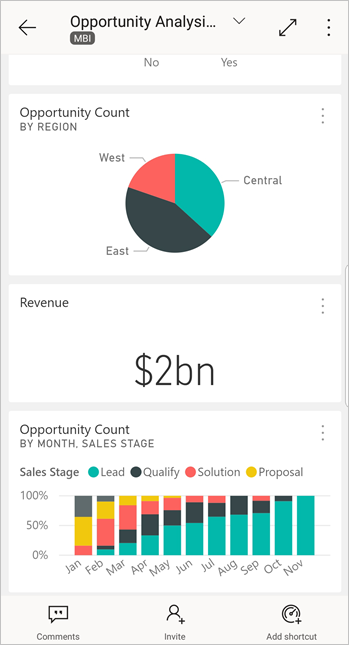
You can view reports on your mobile phone using the Power BI App.
Managers and business owners often use this to check dashboards anytime.
Features of Power BI
Here are some powerful features:
✔ Easy Data Import
You can import data from:
- Excel
- CSV
- SQL Database
- Google Analytics
- Many other sources
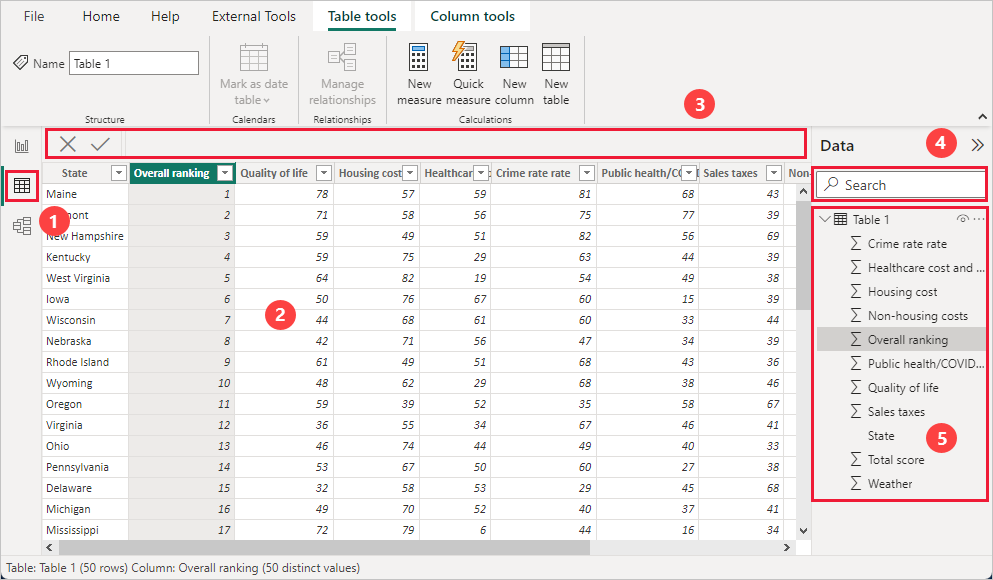
✔ Data Cleaning with Power Query
You can:
- Remove duplicates
- Change data types
- Split columns
- Merge tables
Without writing complex code.
✔ DAX (Data Analysis Expressions)
DAX is a formula language in Power BI.
You can calculate:
- Total Sales
- Profit Percentage
- MTD (Month-To-Date)
- YTD (Year-To-Date)
It is similar to Excel formulas but more powerful.
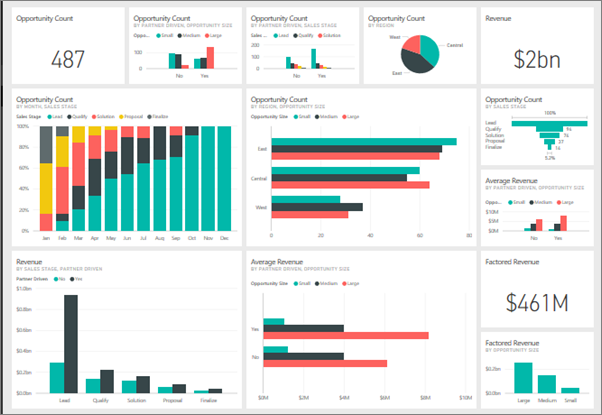
✔ Interactive Dashboards
Users can:
- Click on charts
- Apply filters
- Use slicers
- Drill down into data
How Power BI is Used in Real Companies
Power BI is used for:
- 📈 Sales Dashboard
- 💰 Financial Reports
- 📦 Inventory Tracking
- 👥 HR Analytics
- 📊 Performance Monitoring
Even government departments and large organizations use Power BI for reporting.
Who Should Learn Power BI?
Power BI is perfect for:
- MIS Executives
- Excel Users
- Accountants
- Business Owners
- Students
- Aspiring Data Analysts
If you already know Excel basics, you can easily learn Power BI.
Learn More: Excel Tutorials
Career Opportunities After Learning Power BI
After learning Power BI, you can apply for roles like:
- Data Analyst
- Business Analyst
- MIS Executive
- Reporting Analyst
- BI Developer
Power BI is one of the most in-demand tools in the Data Analytics field.
What We Will Learn Next
In the next tutorial, we will learn:
👉 How to Download and Install Power BI Desktop
👉 Understanding Power BI Interface
👉 Importing Your First Excel File
Final Words
Power BI is not just a tool.
It is a career-changing skill.
If you can use Excel, you can learn Power BI.
Start your journey today and move one step closer to becoming a Data Analyst