|
Getting your Trinity Audio player ready...
|
In Power BI and DAX, working with dates is critical for time-based analysis such as YTD, MTD, QTD, and year-over-year comparisons. To perform such analyses effectively, you need a CALENDAR Function to create date table (also called a calendar table) that contains all dates in your dataset along with useful columns like year, month, quarter, day, weekday, and more.
DAX provides two main functions to create a date table:
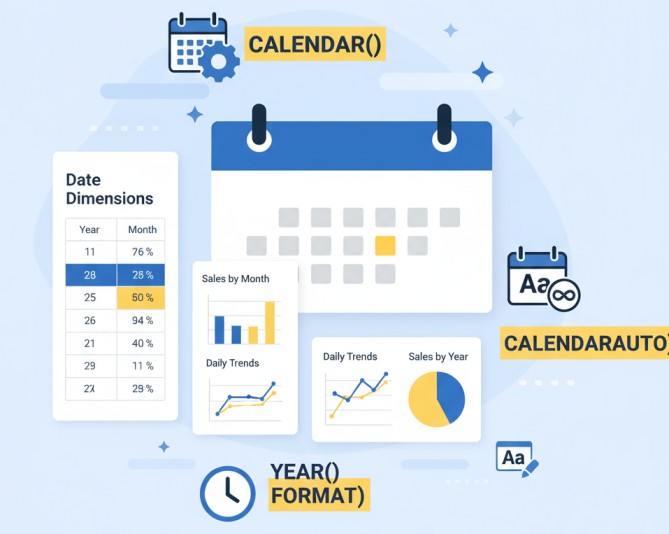
- CALENDAR() – lets you create a date table by specifying a start and end date.
- CALENDARAUTO() – automatically detects the date range from your dataset.
In this article, we’ll explore:
- Syntax and options for CALENDAR() and CALENDARAUTO()
- Creating useful date columns (Year, Month, Quarter, Weekday)
- Real-world examples and best practices for Power BI and MIS reporting
By the end, you’ll know how to create a dynamic, fully-featured date table in DAX.
1. CALENDAR Function
Syntax
CALENDAR(<StartDate>, <EndDate>)
- StartDate – The first date in the calendar. Can be a date literal, DATE(), or calculated value.
- EndDate – The last date in the calendar.
Example 1: Basic Calendar Table
DateTable = CALENDAR(DATE(2023,1,1), DATE(2024,12,31))
Creates a table with one column Date containing all dates between Jan 1, 2023, and Dec 31, 2024.
👉 DATE(): Creates a valid date value in DAX by specifying the year, month, and day as numeric arguments (DATE(Year, Month, Day)).
Using MAX and MIN for Dynamic Calendar
Instead of hardcoding dates, you can make the calendar dynamic based on your dataset:
DateTable = CALENDAR(MIN(Sales[Date]), MAX(Sales[Date]))
Automatically adjusts the calendar to cover all dates present in the Sales table.
2. CALENDARAUTO Function
Syntax
CALENDARAUTO([FiscalYearEndMonth])
- FiscalYearEndMonth (optional) – Number between 1–12 to define the fiscal year end month. Default is 12 (December).
Example 2: Automatic Calendar Table
DateTable = CALENDARAUTO()
Creates a date table covering all dates in your dataset automatically.
Example 3: Fiscal Year Ending in March
DateTable = CALENDARAUTO(3)
Creates a date table with fiscal year ending in March.
3. Adding Useful Columns to the Date Table
Once you have a date column, you can add extra columns to make the table more useful for reporting and analysis.
3.1 Year, Month, Quarter
Year = YEAR(DateTable[Date])
Month = MONTH(DateTable[Date])
MonthName = FORMAT(DateTable[Date], "MMMM")
Quarter = "Q" & FORMAT(DateTable[Date], "Q")
3.2 Weekday
WeekdayNumber = WEEKDAY(DateTable[Date], 2)  -- 1 = Monday
WeekdayName = FORMAT(DateTable[Date], "dddd")
3.3 Fiscal Year
FiscalYear = YEAR(DateTable[Date]) + IF(MONTH(DateTable[Date]) > 3, 1, 0)
3.4 IsWeekend
IsWeekend = IF(WEEKDAY(DateTable[Date], 2) >= 6, TRUE(), FALSE())
4. Creating a Complete Date Table Example
DateTable =
ADDCOLUMNS(
    CALENDAR(MIN(Sales[Date]), MAX(Sales[Date])),
    "Year", YEAR([Date]),
    "MonthNumber", MONTH([Date]),
    "MonthName", FORMAT([Date], "MMMM"),
    "Quarter", "Q" & FORMAT([Date], "Q"),
    "WeekdayNumber", WEEKDAY([Date],2),
    "WeekdayName", FORMAT([Date],"dddd"),
    "IsWeekend", IF(WEEKDAY([Date],2) >= 6, TRUE(), FALSE())
)
Creates a fully-featured date table that is dynamic and works perfectly with Time Intelligence functions like TOTALYTD(), SAMEPERIODLASTYEAR(), and DATEADD().
👉 ADDCOLUMNS(): Adds one or more calculated columns to a table or table expression in DAX, creating new data on the fly while keeping the original table structure.
5. Using the Date Table in Reports
- Mark as Date Table: In Power BI, go to Modeling → Mark as Date Table → Select Date column.
- Use this table to create relationships with fact tables like Sales or Transactions.
- Supports time intelligence calculations without hardcoding dates.
Example: Total Sales YTD using the date table:
Sales YTD = TOTALYTD(SUM(Sales[Amount]), DateTable[Date])
6. Best Practices
- Always create a dedicated date table; don’t rely solely on raw date columns.
- Use CALENDARAUTO() for quick solutions; use CALENDAR() with MIN/MAX for controlled dynamic tables.
- Include extra columns like Year, Month, Quarter, Weekday, and Fiscal Year.
- Mark the table as a Date Table in Power BI to enable Time Intelligence functions.
- Keep the table dynamic if you frequently load new data.
Conclusion
Creating a date table in DAX using CALENDAR() or CALENDARAUTO() is foundational for any time-based analysis in Power BI or MIS reporting.
- CALENDAR() – gives full control over the date range.
- CALENDARAUTO() – automatically detects dataset dates, including fiscal year options.
- Add useful columns like Year, Month, Quarter, Weekday, Fiscal Year for robust reporting.
- Works seamlessly with Time Intelligence functions for dynamic dashboards.
With this knowledge, you can now build professional Power BI reports, perform advanced YTD, MTD, QTD analysis, and create dynamic visualizations that respond to slicers and filters.
What’s Next?
In the next post, we’ll learn about the FORMAT Function in DAX