|
Getting your Trinity Audio player ready...
|
In this post, we will guide you step by step on how to get started with Zoho Sheets, create your first spreadsheet, explore the interface, and understand the key features that make Zoho Sheets a modern, cloud-based alternative to Excel and Google Sheets.
If you are an MIS Officer, Data Analyst, or business professional, this guide will help you work smarter, collaborate faster, and automate tasks efficiently.
Understanding the Basics of a Spreadsheet
Before we dive into Zoho Sheets, let’s quickly understand what a spreadsheet actually is.
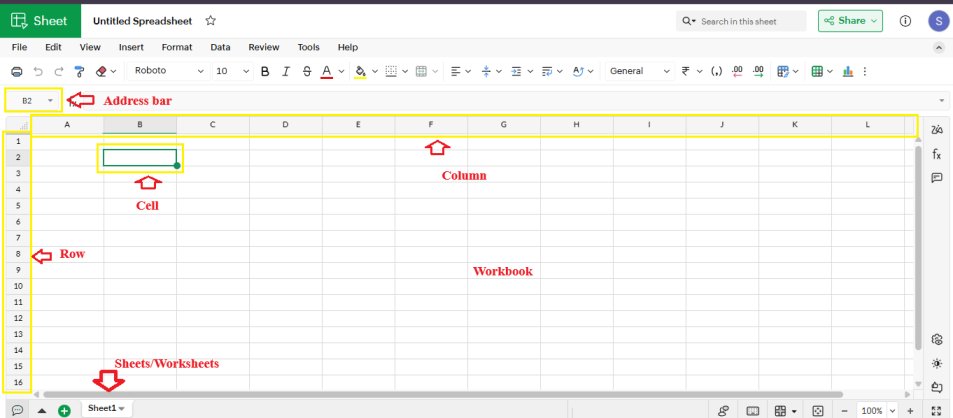
A spreadsheet is a digital grid made up of rows and columns, where each box is called a cell. You can use these cells to store, organize, and calculate data such as numbers, text, or formulas.
In Zoho Sheets, just like in Excel or Google Sheets:
- Each cell has a unique address (for example, B2 means column B, row 2).
- By default, a new Zoho Sheet contains 262144 rows and 2048 columns — giving you plenty of space to work with.
- You can also insert more rows or columns anytime based on your needs.
- Columns are labeled with letters (A, B, C…) and rows are labeled with numbers (1, 2, 3…).
Whether you’re managing office reports, tracking budgets, or analyzing data, these rows and columns form the foundation of all spreadsheet work.
Step 1: Sign Up or Log In to Zoho
Before you can use Zoho Sheets, you need a Zoho account.
- Go to https://www.zoho.com/sheets/
- Click Sign Up (if you don’t have an account) or Login (if you already have one).
- You can also sign in using Google, Facebook, or Apple accounts etc.
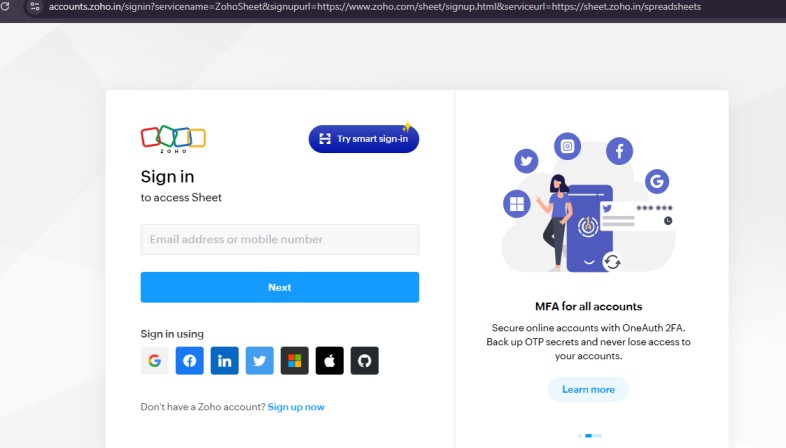
Once logged in, you will be redirected to the Zoho Sheets dashboard where you can see all your spreadsheets and templates and can create New Spreadsheet
Step 2: Create a New Spreadsheet
Creating your first sheet is simple:
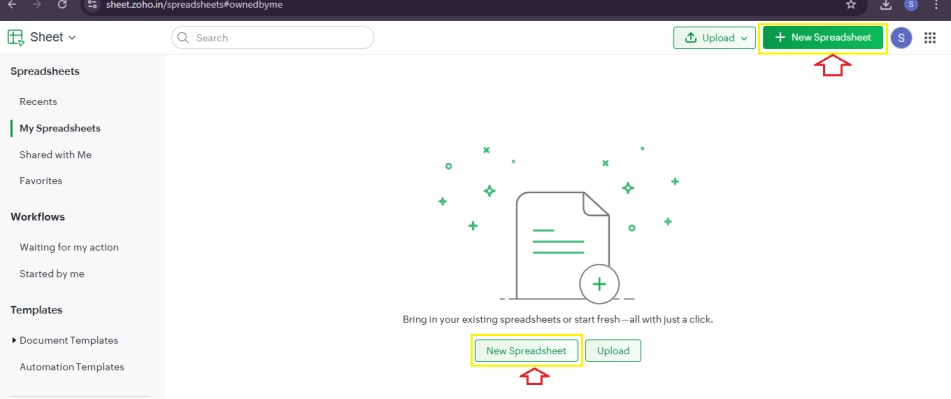
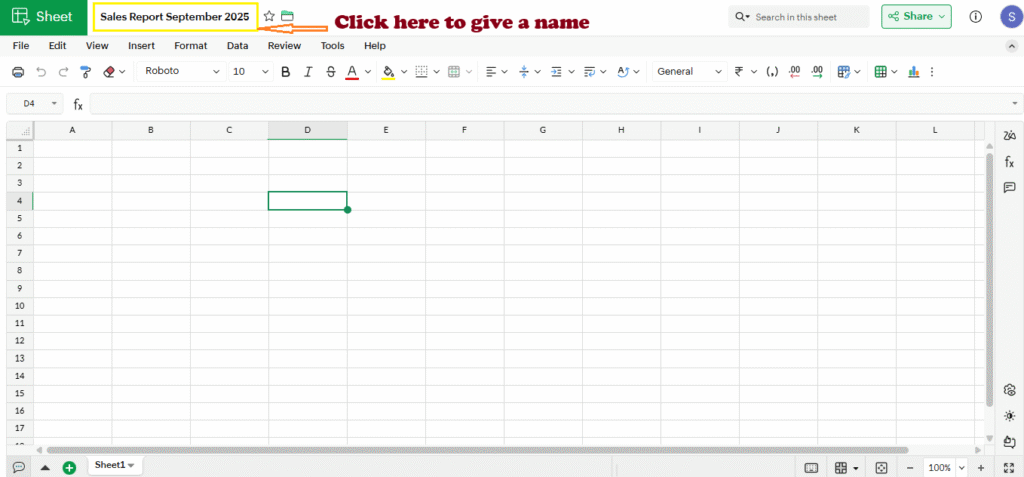
- Click + New Spreadsheet.
- Give it a name (e.g., “Sales Report September 2025”).
- Choose blank spreadsheet or select from pre-built templates like Sales, HR, Finance, Inventory, or Project Tracker.
Using templates is helpful for beginners because they already have pre-set headers, formatting, and formulas.
Step 3: Explore the Zoho Sheets Interface
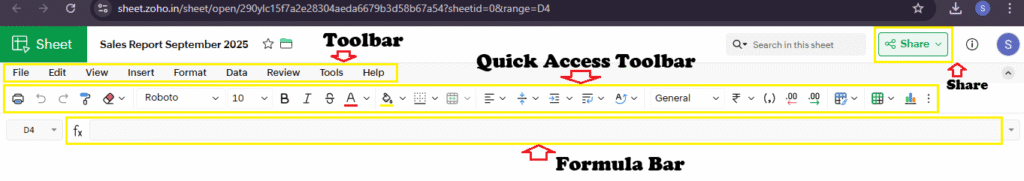
Once your spreadsheet is open, you’ll notice the interface is clean and user-friendly. Key elements include:
- Toolbar / Ribbon: Similar to Excel, includes formatting, insert, data, formulas, and chart options.
- Formula Bar: Enter formulas or view cell contents.
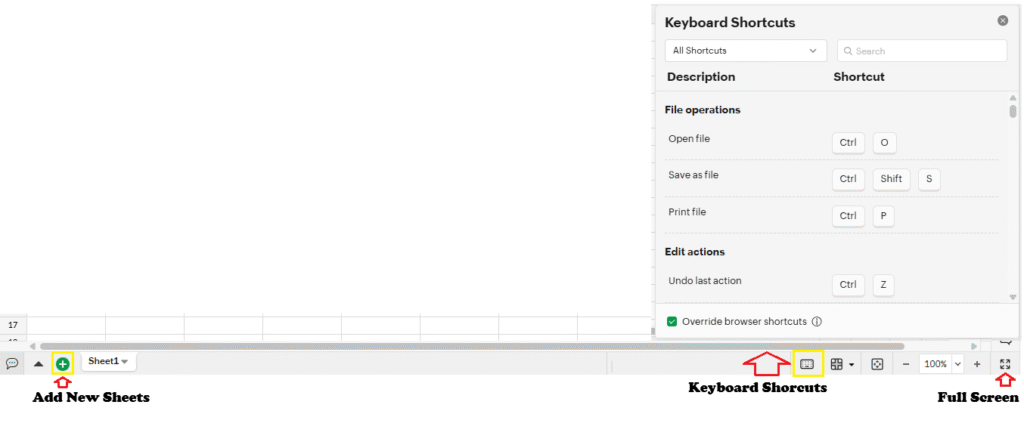
- Sheet Tabs: Switch between multiple sheets within the same file.
- Sidebar: Access Data Cleaning, Pivot Tables, Conditional Formatting, Comments, and Automation.
- Collaboration Tools: Chat, comments, share, and version history.
Step 4: Enter and Format Data
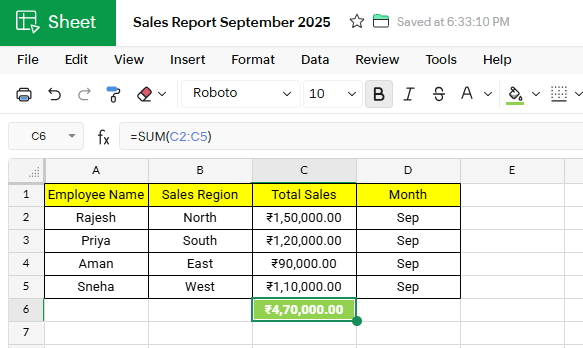
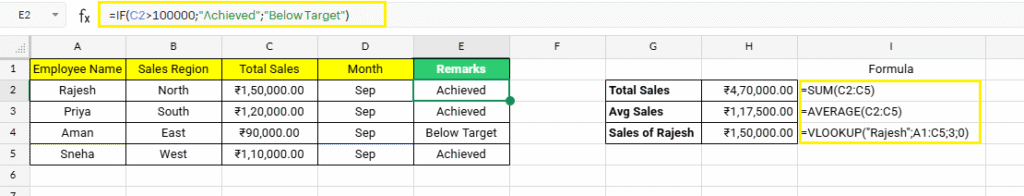
Now, let’s add some basic data. For example, create a monthly sales table:
| Employee Name | Sales Region | Total Sales | Month |
|---|---|---|---|
| Rajesh | North | 150000 | Sep |
| Priya | South | 120000 | Sep |
| Aman | East | 90000 | Sep |
| Sneha | West | 110000 | Sep |
- Type your data directly into cells.
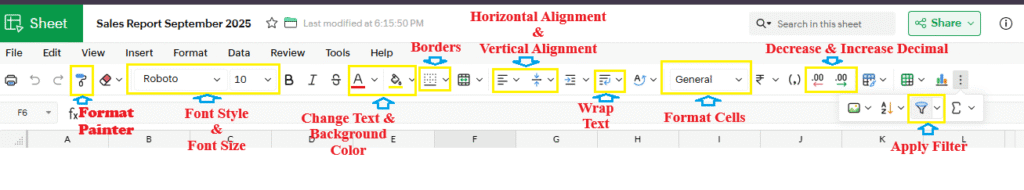
- Format numbers as Currency by selecting the column → Format → Number → Currency.
- Change text alignment, font, or color from the toolbar.
Step 5: Basic Formulas
Zoho Sheets supports almost all Excel-like formulas.
- SUM:
=SUM(C2:C5)→ adds total sales. - AVERAGE:
=AVERAGE(C2:C5)→ calculates average sales. - IF:
=IF(C2>100000,"Achieved","Below Target")→ evaluates performance. - VLOOKUP:
=VLOOKUP("Rajesh", A2:D5, 3, 0)→ fetches Total Sales for Rajesh.
Formulas are dynamic, so when you change any value, results update automatically.
Also Read: Zoho Sheets: India’s Powerful Alternative to Google Sheets and Microsoft Excel
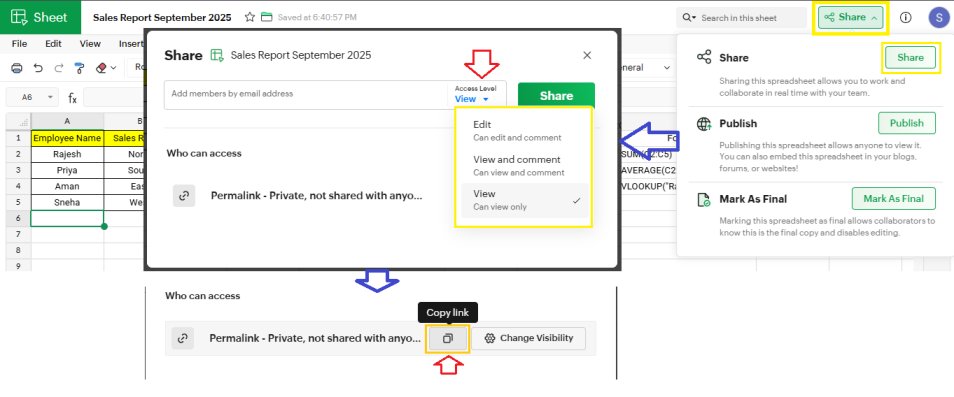
Step 6: Collaborate in Real-Time
One of the biggest advantages of Zoho Sheets over Excel is real-time collaboration, like Google Sheets.
- Click Share at the top-right corner.
- Enter email addresses of your team members.
- Assign permissions: View, Comment, or Edit.
- You can also chat in real-time, see who is editing which cell, and leave comments.
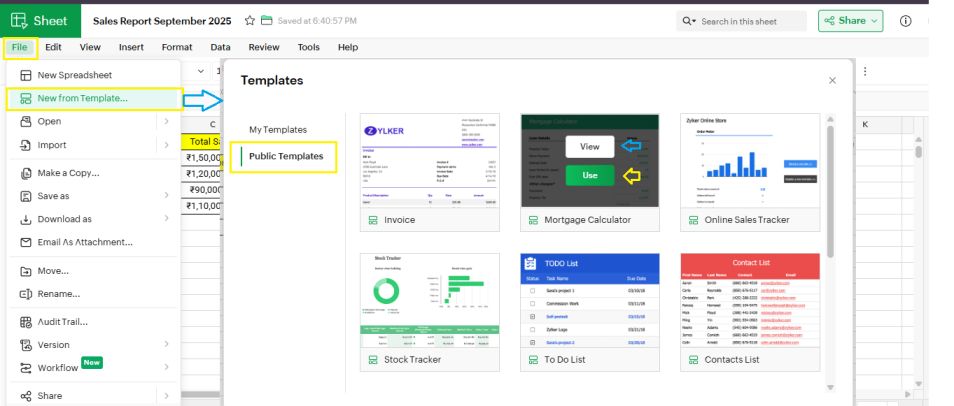
Step 7: Using Templates
Zoho Sheets provides hundreds of free templates for different use cases:
- Sales and Revenue Reports
- Employee Attendance Tracker
- Project Management Dashboard
- Inventory and Stock Management
- Financial Analysis Reports
Using templates helps beginners save time and understand formula usage, charts, and pivot tables.
Step 8: Charts and Visualizations
Creating charts is easy:
- Select your data range.
- Click Insert → Chart.
- Choose Column, Line, Pie, or Combo chart.
- Customize colors, labels, and axes from the chart editor.
Charts in Zoho Sheets are interactive and update automatically when data changes.
Step 9: Data Cleaning and Validation
Zoho Sheets makes data management simpler with Data Cleaning tools:
- Remove duplicates
- Trim extra spaces
- Detect inconsistencies
- Set data validation rules (drop-down lists, number ranges, date restrictions)
This reduces errors and ensures your reports are accurate.
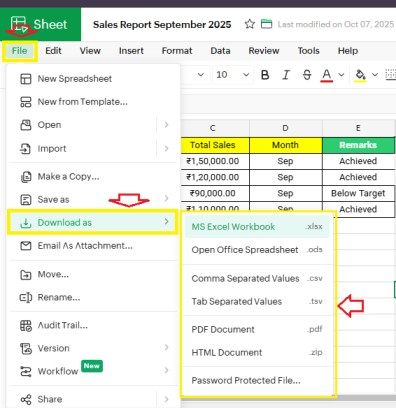
Step 10: Save, Export, and Share
All your changes in Zoho Sheets are saved automatically in the cloud.
You can also:
- Export as Excel, CSV, PDF
- Publish online for view-only sharing
- Embed in websites or dashboards
This flexibility is ideal for MIS reports, management dashboards, and client sharing.
Conclusion
Getting started with Zoho Sheets is easy and intuitive. Within minutes, you can:
- Create your first spreadsheet
- Enter and format data
- Use basic formulas
- Share and collaborate in real-time
- Export Zoho Sheets (Download)
- Build charts and clean your data efficiently
What’s Next?
In the next post, we’ll learn about the Understanding the Toolbar in Zoho Sheets